


Last month, the Pension Integrity Project released a critique regarding an overly-narrow perspective on the cost-effectiveness of defined benefit (DB) pension plans compared to defined contribution (DC) plans. The focus of our critique was a paper by the National Institute on Retirement Security (NIRS) analyzing the cost-efficiency of retirement plans, which is just one element that needs to be considered when evaluating retirement plans. A complete perspective on retirement plans must include factors that are even more important to achieving the pension system’s overarching goals—namely benefit efficiency, which is a way to measure how widespread the benefits are distributed among the members in a retirement plan, whether it be a defined contribution or defined benefit plan.
Which plan type does a better job of actually delivering benefits to the most people?
It is important to understand the often-overlooked concept of benefit efficiency in concrete conditions. To demonstrate, a hypothetical retirement plan called PERS (Public Employee Retirement System) can serve as a stand-in. This hypothetical pension system uses common characteristics among public retirement plans that offer both DC and DB options. A full list of parameters used for this modeling is provided at the end of this piece.
Using these parameters and other turnover and mortality data, this piece will examine how a DB plan compares to a DC plan for a cohort of 1,000 employees by comparing their accumulated benefits over a potential lifetime (based on mortality rates). This analysis demonstrates that the DB plan does become optimal when compared to a DC plan for an individual around age 55-60 depending on the entry age. However, for a group of 1,000 employees and for certain entry ages like 22, the DB plan as a whole is never more valuable than the DC plan as a whole.
For this hypothetical plan, only 33% of workers starting at age 22 remain in their jobs after five years, which is in line with expected retention rates for most public pension plans. For later entry ages, retention beyond the first five years goes as high as 50%. At the 30-years-of-service mark, only about 8%-to-12% of employees remain in their jobs, depending on the entry age.
DB vs DC analysis for a group of employees
To include a valuable comparison of how portable DB benefits are compared to DC benefits, the comparison of accumulated benefits will only be made for employees who leave the system. This analysis assumes that a person in a DB plan will try to attain their maximum possible benefit, meaning that if a PERS employee separates (in other words, take another job) at age 35, this comparison would be for their accumulated DC balance to the maximum possible DB benefits they could collect by waiting until the pension systems retirement eligibility.
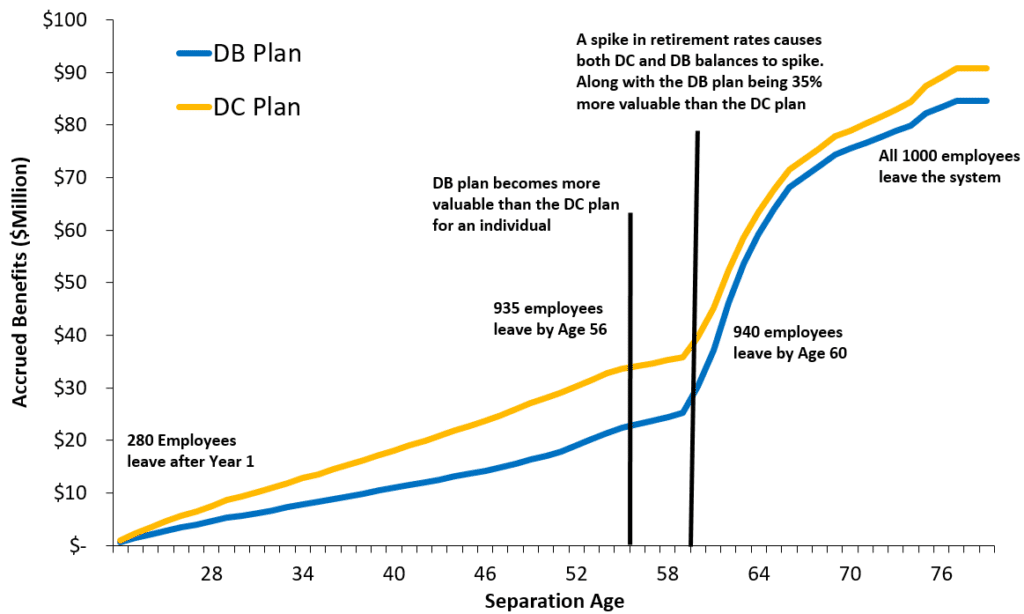
The first scenario looks at the cumulative benefits distributed between DC versus DB plans for a standard entry age of 22. Figure 1 shows the cumulative benefits of a DC versus DB plan for every new employee that leaves the system. The first thing that stands out is the stark increase in balances at age 60 for both the DC and DB plans.
This increase is for two reasons: a spike in retirement rates and a spike in individual DB benefits. For retirement rates, about 940 people leave the system by age 60 and within just six years only two-thirds of them remain. Therefore, even though the individual DC balances grow steadily over time, the cumulative DC balances also spike because this analysis looks at cumulative balances for those who leave the system.
As for the spike in individual DB benefits, it is a little more nuanced. The DB benefit becomes better than the DC benefit for an individual around age 56 when the person has worked for 34 years and is eligible for full retirement under the “Rule of 90” (see appendix). This relative value of a DB over a DC plan increases and peaks at age 60 where the maximum possible DB benefit at age 60 is 35% more valuable than the DC plan. This combined with increased retirement rates leads to a massive spike in cumulative DB balances around age 60.
Despite the rise, the DB never crosses the DC plan in cumulative terms for this entry age. That is because the DB plan eventually becomes worse than the DC plan if the person waits too long to retire, specifically at a cutoff point around 70. While the annual benefits will increase for those working longer, a person may not live long enough to reap the full benefits, and thus it is no longer advantageous.
Figure 1: Cumulative Benefits Distributed (Entry Age 22)
This trend differs slightly but is still similar to other entry ages. In Figure 2, the ratio (vested DB benefits to vested DC benefits) is used to make a similar comparison of cumulative benefits for an aging workforce using different ages of entry.
Figure 2: Ratio of Cumulative Benefits (DB/DC) for different entry ages

At the entry age of 52, the defined benefit plan quickly becomes a better option when compared to the defined contribution plan due to early retirement eligibility. Of course, entering the workforce at 52 is not a typical scenario for most people and neither is staying at a job long enough to enjoy the comparative advantage of a defined benefit plan, as this analysis shows based on the retention rates.
Conclusion
The claim that a defined benefit plan is more efficient than a defined contribution plan, purely on a basis of cost, overlooks a larger and more meaningful perspective regarding benefit distribution. Most members of a DB plan do not stay at their jobs long enough to enjoy this “efficiency.”
Using the hypothetical PERS plan, fewer than 12% of employees make it to full retirement across all entry ages, yet the advantages of the DB retirement benefits seem to be tailored to this select group only. The vast majority of workers are better off with a defined contribution plan because the benefits they earn are not frozen when they leave for other employment.
Additional notes on this analysis
Key Parameters
- Assumed Inflation – 2.25%
- Salary Growth Rate – 3.50%
- Vesting Period – 5 years
- Final Average Salary – 5 years
- Interest Credit – 6.5%
- Benefit Multiplier – 2.00%
- COLA – 0%
- Assumed Rate of Return – 7% for DB Plan, 6% for DC Plan
- Employee Contribution rate – 7% for DC and DB Plan
- Employer Contribution rate – 7% for DC and DB Plan
Retirement Conditions
- Regular Retirement
- Age 65 with 5 years of service
- Age + years of service >= 90. Known as the rule of 90
- Early Retirement – Age 60 with 5 years of service
This analysis assumes a 6% return for the defined contribution plan and a 7% return for the defined benefit plan. This is based on the NIRS assumption that the DB plan is managed by sophisticated fund managers and can therefore generate higher returns. This point was rebutted in the previous piece based on returns generated by pension funds vis-à-vis index funds to highlight the value of fund managers. This analysis focuses on benefit distribution, so the assumption of a higher DB return is used.
Stay in Touch with Our Pension Experts
Reason Foundation’s Pension Integrity Project has helped policymakers in states like Arizona, Colorado, Michigan, and Montana implement substantive pension reforms. Our monthly newsletter highlights the latest actuarial analysis and policy insights from our team.