


In the overall rankings of state highway performance and cost-effectiveness, Reason Foundation’s 25th Annual Highway Report finds North Dakota, Missouri, and Kansas have the nation’s best state-owned road systems. In terms of return on investment, New Jersey, Alaska, Delaware, and Massachusetts have the worst-performing state highway systems, the study finds.
Of the nation’s most populous states, Ohio (ranked 13th overall), North Carolina (14th)—which manages the largest state-owned highway system, and Texas (18th)—with the second-largest amount of state mileage, are doing the best job of combining road performance and cost-effectiveness. In contrast, New York (ranked 44th overall), California (43rd), and Florida (40th) are in the bottom 10 overall.
The 25th Annual Highway Report finds the general quality and safety of the nation’s highways has incrementally improved as spending on state-owned roads increased by 9 percent, up to $151.8 billion, since the previous report. Of the Annual Highway Report’s nine categories focused on performance, including structurally deficient bridges and traffic congestion, the country made incremental progress in seven of them.
However, the pavement condition of the nation’s urban Interstate system worsened slightly. Over a quarter of the urban Interstate mileage in poor condition is in just three states: California, New York, and, perhaps surprisingly, Wyoming.
The study also finds drivers in 11 states spent more than 50 hours per year in traffic congestion, with commuters in the three most-congested states—Delaware, Illinois, and Massachusetts—spending over 100 hours per year in traffic congestion in 2019.
Most states—35 out of 50 —reduced their overall traffic fatality rates. Massachusetts, Minnesota, and New Jersey reported the overall lowest fatality rates while South Carolina, Mississippi, Louisiana, and Arizona had the highest fatality rates.
In the report’s spending categories, Missouri, Mississippi, South Carolina, North Dakota, and Tennessee reported the lowest expenditures per mile. New Jersey, Massachusetts, Alaska, Delaware, and Maryland had the highest costs most per-mile. In total, the 50 states disbursed $151.8 billion for state-owned roads, a 9.2 percent increase from $139 billion in 2016, the previous data available.
The condition of the nation’s bridges improved slightly in 2019. Of the 613,517 highway bridges reported, 46,771 (7.6 percent) were rated deficient. The best rankings go to three states where less than two percent of their bridges are structurally deficient: Texas, Nevada, and Arizona. Meanwhile, Rhode Island reported a whopping 23 percent of its bridges as structurally deficient.
Five states made double-digit improvements in their overall performance and cost-effectiveness rankings: Arkansas improved from 32nd to 9th overall; Mississippi moved from 25th to 8th; Wisconsin went from 38th to 22nd; South Carolina jumped from 20th to 6th; and Iowa improved from 31st to 20th overall.
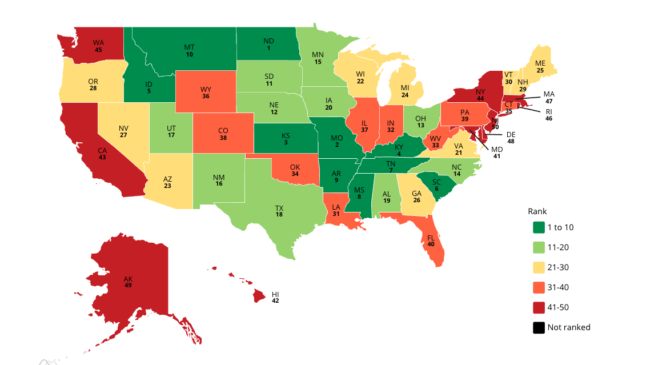
25th Annual Highway Report Overall Performance and Cost-Effectiveness Rankings
Click a state name for detailed information about its results.
“Although it is tempting to ascribe these ratings to geography or population, a more careful review suggests that numerous factors, including terrain, climate, truck traffic volumes, urbanization and congestion, system age, budget priorities, and management and maintenance practices all significantly impact state highway performance,” says Baruch Feigenbaum, lead author of the report and managing director of transportation policy at Reason Foundation. “The states with the three largest highway systems—North Carolina, Texas, and Virginia—all rank in the top 21 this year. Meanwhile, states with the smallest amount of mileage to manage, like Hawaii, Rhode Island, and New Jersey, are some of the worst-performing states. Prioritizing maintenance, targeting and fixing problem areas, and reducing bottlenecks are among the successful strategies states can use to improve their quality and efficiency.”
Reason Foundation’s Annual Highway Report measures the condition and cost-effectiveness of state-controlled highways in 13 categories, including pavement condition, traffic congestion, structurally deficient bridges, traffic fatalities, and spending (capital, maintenance, administrative, overall) per mile. The Annual Highway Report is based on spending and performance data submitted by state highway agencies to the federal government for 2018 as well as 2019 urban congestion data from INRIX and bridge condition data from the Better Roads inventory for 2019.
25th Annual Highway Report: Each State’s Highway Performance Ranking By Category
| State | Overall | Total Disbursements per Mile | Capital & Bridge Disbursements per Mile | Maintenance Disbursements per Mile | Admin Disbursements per Mile | Rural Interstate Pavement Condtion | Urban Interstate Pavement Condition | Rural Arterial Pavement Condition | Urban Arterial Pavement Condition | Urbanized Area Congestion | Structural Deficient Bridges | Overall Fatality Rate | Rural Fatality Rate | Urban Fatality Rate |
|---|---|---|---|---|---|---|---|---|---|---|---|---|---|---|
| Alabama | 19 | 18 | 32 | 4 | 36 | 25 | 36 | 14 | 3 | 19 | 9 | 37 | 29 | 36 |
| Alaska | 49 | 48 | 49 | 46 | 42 | 48 | 17 | 50 | 21 | 5 | 38 | 44 | 46 | 49 |
| Arizona | 23 | 17 | 26 | 5 | 37 | 37 | 10 | 26 | 10 | 31 | 3 | 47 | 31 | 48 |
| Arkansas | 9 | 9 | 25 | 6 | 2 | 35 | 34 | 27 | 19 | 12 | 11 | 39 | 40 | 46 |
| California | 43 | 40 | 40 | 42 | 47 | 41 | 44 | 38 | 48 | 45 | 24 | 18 | 35 | 29 |
| Colorado | 38 | 26 | 28 | 34 | 40 | 47 | 33 | 16 | 30 | 37 | 18 | 29 | 30 | 33 |
| Connecticut | 35 | 42 | 43 | 38 | 31 | 1 | 12 | 35 | 29 | 28 | 26 | 12 | 7 | 27 |
| Delaware | 48 | 47 | 41 | 49 | 50 | NA | 47 | 1 | 20 | 50 | 8 | 24 | 48 | 17 |
| Florida | 40 | 45 | 47 | 41 | 33 | 9 | 14 | 3 | 1 | 34 | 6 | 40 | 38 | 43 |
| Georgia | 26 | 22 | 9 | 24 | 43 | 32 | 15 | 7 | 2 | 42 | 7 | 26 | 8 | 38 |
| Hawaii | 42 | 35 | 36 | 32 | 28 | NA | 49 | 48 | 38 | 4 | 22 | 23 | 50 | 47 |
| Idaho | 5 | 11 | 11 | 12 | 9 | 22 | 3 | 6 | 11 | 1 | 23 | 35 | 36 | 39 |
| Illinois | 37 | 37 | 42 | 31 | 19 | 21 | 32 | 36 | 26 | 49 | 32 | 15 | 16 | 22 |
| Indiana | 32 | 27 | 24 | 43 | 18 | 45 | 43 | 21 | 7 | 32 | 21 | 19 | 25 | 21 |
| Iowa | 20 | 25 | 34 | 19 | 16 | 18 | 27 | 43 | 31 | 2 | 48 | 16 | 15 | 7 |
| Kansas | 3 | 7 | 3 | 7 | 15 | 8 | 22 | 4 | 13 | 11 | 17 | 32 | 45 | 12 |
| Kentucky | 4 | 10 | 10 | 21 | 1 | 17 | 19 | 10 | 14 | 13 | 25 | 45 | 21 | 34 |
| Louisiana | 31 | 20 | 6 | 26 | 5 | 43 | 48 | 45 | 37 | 35 | 44 | 48 | 11 | 45 |
| Maine | 25 | 24 | 20 | 33 | 6 | 28 | 4 | 47 | 34 | 33 | 45 | 11 | 9 | 1 |
| Maryland | 41 | 46 | 45 | 44 | 29 | 27 | 41 | 22 | 35 | 47 | 15 | 7 | 1 | 24 |
| Massachusetts | 47 | 49 | 48 | 40 | 49 | 30 | 26 | 39 | 45 | 48 | 36 | 1 | 2 | 8 |
| Michigan | 24 | 15 | 19 | 22 | 20 | 42 | 46 | 17 | 39 | 26 | 41 | 14 | 6 | 25 |
| Minnesota | 15 | 19 | 14 | 30 | 23 | 33 | 35 | 24 | 6 | 36 | 14 | 2 | 3 | 4 |
| Mississippi | 8 | 2 | 8 | 3 | 12 | 31 | 23 | 23 | 27 | 9 | 37 | 49 | 42 | 42 |
| Missouri | 2 | 1 | 1 | 9 | 4 | 10 | 16 | 12 | 22 | 20 | 33 | 31 | 23 | 30 |
| Montana | 10 | 13 | 18 | 13 | 14 | 24 | 11 | 34 | 36 | 14 | 28 | 42 | 37 | 2 |
| Nebraska | 12 | 8 | 16 | 25 | 3 | 16 | 31 | 32 | 47 | 7 | 34 | 25 | 22 | 14 |
| Nevada | 27 | 30 | 33 | 20 | 41 | 20 | 24 | 2 | 5 | 18 | 2 | 27 | 41 | 37 |
| New Hampshire | 29 | 23 | 15 | 27 | 44 | 1* | 1 | 30 | 25 | 27 | 35 | 22 | 34 | 18 |
| New Jersey | 50 | 50 | 50 | 50 | 48 | 36 | 45 | 46 | 44 | 40 | 29 | 3 | 4 | 23 |
| New Mexico | 16 | 16 | 2 | 1 | 38 | 23 | 18 | 28 | 33 | 17 | 20 | 41 | 27 | 50 |
| New York | 44 | 44 | 39 | 48 | 34 | 40 | 42 | 40 | 46 | 29 | 39 | 5 | 44 | 5 |
| North Carolina | 14 | 14 | 21 | 14 | 8 | 19 | 6 | 20 | 16 | 25 | 40 | 30 | 49 | 26 |
| North Dakota | 1 | 4 | 12 | 2 | 7 | 5 | 5 | 19 | 28 | 3 | 42 | 21 | 28 | 10 |
| Ohio | 13 | 21 | 22 | 16 | 21 | 29 | 29 | 18 | 42 | 21 | 19 | 13 | 5 | 15 |
| Oklahoma | 34 | 31 | 31 | 35 | 35 | 34 | 39 | 42 | 24 | 16 | 43 | 43 | 20 | 31 |
| Oregon | 28 | 34 | 29 | 28 | 32 | 11 | 25 | 13 | 18 | 38 | 16 | 38 | 43 | 19 |
| Pennsylvania | 39 | 43 | 37 | 39 | 30 | 38 | 40 | 33 | 32 | 43 | 46 | 28 | 10 | 32 |
| Rhode Island | 46 | 41 | 44 | 45 | 39 | 1 | 7 | 49 | 49 | 46 | 50 | 4 | 26 | 16 |
| South Carolina | 6 | 3 | 5 | 8 | 11 | 14 | 20 | 29 | 9 | 15 | 31 | 50 | 47 | 44 |
| South Dakota | 11 | 6 | 4 | 10 | 26 | 13 | 13 | 25 | 17 | 23 | 47 | 36 | 32 | 9 |
| Tennessee | 7 | 5 | 7 | 18 | 27 | 12 | 8 | 9 | 8 | 24 | 10 | 33 | 18 | 35 |
| Texas | 18 | 28 | 30 | 23 | 10 | 15 | 28 | 11 | 40 | 41 | 1 | 34 | 33 | 40 |
| Utah | 17 | 36 | 35 | 29 | 24 | 7 | 9 | 15 | 4 | 6 | 4 | 6 | 17 | 28 |
| Vermont | 30 | 33 | 27 | 37 | 45 | 5 | 1 | 44 | 23 | 30 | 5 | 10 | 12 | 3 |
| Virginia | 21 | 32 | 17 | 36 | 22 | 4 | 21 | 5 | 15 | 44 | 13 | 17 | 13 | 11 |
| Washington | 45 | 39 | 38 | 47 | 46 | 46 | 38 | 31 | 43 | 39 | 12 | 8 | 19 | 20 |
| West Virginia | 33 | 38 | 46 | 17 | 13 | 39 | 30 | 41 | 12 | 10 | 49 | 46 | 24 | 41 |
| Wisconsin | 22 | 29 | 13 | 11 | 25 | 44 | 37 | 37 | 41 | 22 | 27 | 9 | 14 | 13 |
| Wyoming | 36 | 12 | 23 | 15 | 17 | 26 | 50 | 8 | 50 | 8 | 30 | 20 | 39 | 6 |
Editor’s Note (Jan. 12, 2021): The Federal Highway Administration (FHWA) has identified an “error in the 2018 HM-64 Highway Statistics table” that it is still in the process of correcting. This FHWA error in the 2018 HM-64 table negatively impacted Wyoming’s pavement condition figures and rankings in the 25h Annual Highway Report. And, as a result, the FHWA data error would have also played a role in Wyoming’s overall ranking falling from 11th overall in the previous report to 36th overall in the 25th Annual Highway Report.